 Coaching Centre
The Hertzsprung–Russell diagram
How to read the Hertzsprung–Russell diagram, the main sequence and why mass decides where a star sits on it, giants, supergiants and white dwarfs, why massive stars live short lives, using clusters to find the ages of stars, and why most stars are red dwarfs.
Around 1910, two astronomers working separately, Ejnar Hertzsprung in Denmark and Henry Norris Russell in the United States, each tried a simple idea: plot a star's brightness against its colour. If stars came in random combinations the graph would be a scatter of dots. Instead almost all the stars fell along a narrow band, with a few small groups elsewhere. That pattern turned out to be the key to how stars live and die.
Reading the diagram
A Hertzsprung–Russell (H–R) diagram plots stars by two properties:
- Horizontal axis: surface temperature (or spectral class, or colour). By tradition it runs backwards: hot blue stars on the left, cool red stars on the right.
- Vertical axis: luminosity, compared with the Sun (or absolute magnitude). Each step up the scale is a multiplication, here by 100, so that both very dim and very bright stars fit.
Because luminosity depends on radius² × temperature⁴ (6C), the position of a star also tells you its size. Two stars at the same temperature but different luminosities must be different sizes: the brighter one is bigger. That's why the diagram has four main regions:
| Region | Where on the diagram | What the stars are like | Examples |
|---|---|---|---|
| Main sequence | Diagonal band from top left to bottom right | Stars fusing hydrogen into helium in their cores. About 90% of all stars, and about 90% of each star's life. | Sun, Sirius A, Acrux, Proxima Centauri |
| Giants | Above the main sequence, on the right | Cool but bright, so large: 10 to 100 times the Sun's radius. Older stars that have run out of hydrogen in their cores. | Aldebaran, Arcturus |
| Supergiants | Across the top | The most luminous stars, up to about 1000 times the Sun's radius. Massive stars late in their lives. | Betelgeuse, Rigel, Antares, Canopus |
| White dwarfs | Below the main sequence, on the left | Hot but dim, so tiny: about the size of Earth. Exposed cores of dead stars. | Sirius B, Procyon B |
The main sequence is a mass sequence
A main-sequence star's position isn't random: it is set mainly by its mass. The more massive a star, the more its gravity squeezes its core, the hotter the core and the faster fusion runs. So massive stars sit at the top left (hot and very luminous) and low-mass stars at the bottom right (cool and dim).
| Mass (Sun = 1) | Surface temperature | Luminosity (Sun = 1) | Main-sequence lifetime |
|---|---|---|---|
| 0.1 | about 2800 K (red) | about 0.001 | trillions of years |
| 1 (the Sun) | 5800 K (yellow-white) | 1 | about 10 billion years |
| 3 | about 12 000 K (blue-white) | about 50 to 100 | about 500 million years |
| 10 | about 25 000 K (blue) | about 5000 to 10 000 | about 30 million years |
| 40 | about 40 000 K (blue) | about 200 000 | about 5 million years |
Notice that luminosity rises much faster than mass. A star with 10 times the Sun's fuel uses it thousands of times faster, so it runs out far sooner. Big stars live fast and die young.
A main-sequence star has 10 times the mass of the Sun and about 3000 times its luminosity. Roughly how long will it last, if the Sun lasts 10 billion years?
It has about 10 times as much hydrogen to burn.
It uses fuel about 3000 times as fast.
lifetime ≈ 10 billion years × 10 ÷ 3000 ≈ 33 million years. That is only half the time since the dinosaurs died out 66 million years ago.
Finding the age of a star cluster
Stars in a cluster were all born from the same cloud at about the same time, so they are all the same age and at about the same distance. That makes clusters perfect for testing ideas about stars. Plot a cluster on an H–R diagram and the main sequence looks as if it has been peeled away from the top: the massive stars have already used up their hydrogen and moved off to become giants and supergiants.
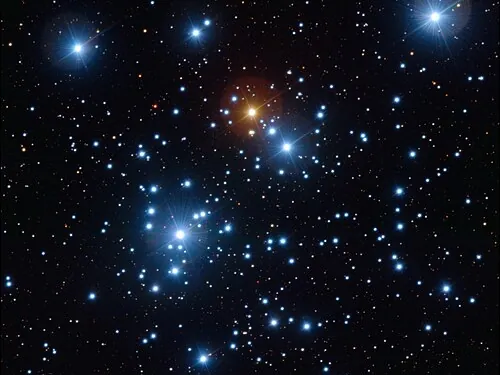
The point where the main sequence bends away, called the turn-off point, acts as a clock. A young cluster such as the Jewel Box, beside the Southern Cross, still has hot blue stars at the top of its main sequence. In 47 Tucanae, a globular cluster easily seen with your eyes from Australia, the main sequence turns off just above stars like the Sun, which means everything more massive has died: the cluster is about 12 billion years old. Globular clusters are some of the oldest objects in the Milky Way.
Most stars are red dwarfs
The bright stars in our sky give a misleading picture. Of the stars within about 30 light years of the Sun, around three quarters are small, cool red dwarfs at the bottom of the main sequence, yet not one of them is visible without a telescope. They are too dim. Even Proxima Centauri, the closest star of all, needs a telescope. The Sun is brighter than about 90% of the stars in the galaxy.
The H–R diagram also gives a way of measuring distance. If a star's spectrum shows it is a main-sequence star of a particular class, you can read its luminosity from the diagram, then compare that with how bright it looks (6B).
- Leave the regions hidden. For each star, read its temperature and luminosity and click where you think it belongs. How many did you put in the right region?
- Turn on the regions. Which stars are on the main sequence, which are giants or supergiants, and which are white dwarfs?
- Procyon B and Altair have almost the same temperature, yet Altair is over 20 000 times more luminous. What must be different about them?
- Turn on the radius lines. Which of the stars is the largest, and which is the smallest?
- Where would a star go that is twice as hot as the Sun and the same size? (Hint: 2⁴.)
Test yourself
On an H–R diagram, the hottest stars are plotted
The temperature axis runs backwards, from hot to cool.
A star in the top right corner of the H–R diagram is
Cool but very luminous means a huge surface: a supergiant.
What mainly decides where a star sits on the main sequence?
More massive stars are hotter and more luminous.
Sirius B is about 25 000 K but only 0.056 times as luminous as the Sun. It must be
Hot but dim means a tiny surface: a white dwarf.
A cluster's main sequence turns off just above stars like the Sun. The cluster is
Only stars with lifetimes of about 10 billion years or more remain on the main sequence.
Label the H–R diagram.
Classify each star from its description.
On an H–R diagram, luminosity is plotted against surface . Most stars lie on the sequence. A star's position on it depends mainly on its . Stars near the top right are , and the most common stars of all are red .
A student says: "The most massive stars have the most fuel, so they must live the longest." Use the H–R diagram and the relationship between mass, luminosity and lifetime to evaluate this claim. Include a calculation in your answer.
The student is right that massive stars have more hydrogen, but the conclusion is wrong. On the H–R diagram, massive main-sequence stars sit at the top left: they are much hotter and far more luminous than the Sun. Their stronger gravity makes their cores hotter and denser, so fusion runs much faster. Luminosity rises much faster than mass, so they use their fuel far more quickly than the extra fuel can make up for.
For example, a star of 10 solar masses has 10 times the Sun's fuel but is about 3000 times as luminous. Its lifetime is about 10 billion years × 10 ÷ 3000 ≈ 33 million years, compared with 10 billion years for the Sun. A red dwarf of 0.1 solar masses uses its fuel so slowly that it will last trillions of years.
Observations agree: young clusters such as the Jewel Box still contain hot blue stars, but old globular clusters have none left, because all their massive stars have already died. So the most massive stars live the shortest lives.