 Coaching Centre
Designing a valid experiment
Writing a hypothesis with a reason, the difference between a control group and controlled variables, choosing the values of the independent variable, why sample size and replicates matter, randomisation and blind testing, and choosing equipment.
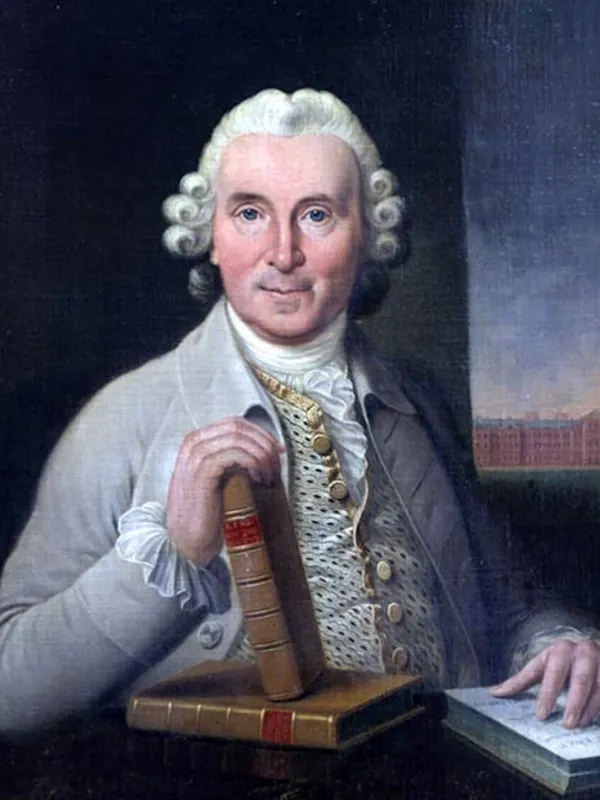
On 20 May 1747, aboard the warship HMS Salisbury, naval surgeon James Lind took 12 sailors sick with scurvy, kept them in the same quarters on the same basic diet, and split them into six pairs. Each pair got a different extra: cider, a weak acid, vinegar, sea water, a spicy paste, or two oranges and a lemon a day. Within a week, the pair eating citrus were nearly well. Lind's test was small, but it had something new: groups treated the same in every way except one. It is often called the first controlled clinical trial.
A hypothesis with a reason
In Year 7 you wrote predictions. At Stage 5 a hypothesis should be a testable statement about the relationship between the independent and dependent variables, with a scientific reason drawn from your background research:
If [IV changes in this way], then [DV will change in this way], because [scientific reason].
For example: "If pots are covered with organic mulch, they will lose less water than bare soil, because mulch shades the soil and slows the air moving over it, reducing evaporation." A hypothesis must be able to be shown wrong by your results. If no possible result could disagree with it, it isn't testable. Results that agree with a hypothesis support it; they never prove it, because a later test might still disagree.
Control groups and controlled variables
These two terms sound alike but mean different things:
- Controlled variables are all the other factors kept the same for every group (see Year 7, 1E).
- A control group (or experimental control) is a group that does not get the treatment at all, such as pots with no mulch, or seedlings watered with plain water. It shows what happens without the independent variable, so you can see how big the effect really is.
In medical trials the control group is often given a placebo, a dummy treatment that looks the same as the real one, because people can feel better just from believing they are being treated.
Choosing the values of the independent variable
If your independent variable is a number (concentration, temperature, depth), choose its values carefully:
- Use at least five values so you can see the shape of the relationship, and include zero if it makes sense (it acts as your control).
- Spread them across a wide enough range to see the whole effect, and space them evenly.
- Run a pilot test to find the interesting range before the real experiment.
Sample size and replicates
Living things vary. Two seedlings from the same packet, in the same soil, can differ in height by several centimetres. If you test one plant per group, a difference might just be luck. Using several individuals per group (replicates) and calculating the mean lets the real effect show through the natural variation.
How many is enough? In a school project, aim for at least 3 replicates per value for physical experiments with little variation, and 10 or more per group for living things or people. If you can't afford many replicates, test fewer values of the independent variable rather than skimping on repeats.
Randomisation and blind testing
Hidden differences between groups can creep in without you noticing. If all the fertilised seedlings sit near the window, they also get more light, and you can't tell which caused the extra growth. This is a confounding variable. The fix is randomisation: assign pots to positions by drawing numbers or using a random number generator, and swap positions regularly.
People are also a source of bias. If you know which plants were fertilised, you might measure them a little more generously without meaning to. In a blind test the person measuring doesn't know which group each sample belongs to. In a double-blind trial, neither the participants nor the researchers know who got the real treatment until the end.
- Use 1 seedling per group and press Run it again five times. How much does the difference between the groups jump around?
- Now use 30 per group. Why are the results much more consistent?
- Switch to "Seaweed pots by the window". Why does the effect look bigger? What variable has crept in?
- Turn off the control group. What question can you no longer answer?
Making it quantitative
Qualitative observations (colour, smell, "more bubbles") are useful in a pilot test, but your main data should be numbers you can graph and compare. Most qualitative questions can be turned into quantitative ones:
| Qualitative | Quantitative version |
|---|---|
| Which paper towel is best? | Volume of water absorbed per sheet (mL) |
| Which antacid works best? | Volume of acid neutralised per tablet, measured by titration (mL) |
| Does the soil look drier? | Mass of water lost (g), or soil moisture with a probe (%) |
| Which sunscreen protects better? | UV index measured through coated film |
Choose equipment to suit the size of what you're measuring: a trundle wheel for metres, a ruler for centimetres, vernier calipers for tenths of a millimetre; a balance reading to 0.1 g or 0.01 g rather than kitchen scales; a measuring cylinder rather than a beaker for volume. Page 8F explains how the instrument affects your uncertainty.
Test yourself
In an experiment testing whether a seaweed extract increases tomato yield, the control group should be
The control group differs only in not receiving the treatment.
A student puts all the treated plants on the sunny side of a greenhouse. Light is now a
It differs between groups and could cause the result.
Why do biological experiments usually need larger sample sizes than many physics experiments?
Natural variation hides small effects in small samples.
In a double-blind trial
It removes bias from both sides.
Label the experimental design.
What does each change mainly improve?
A dummy treatment given to a control group is a . Assigning samples to groups by chance is called . Several individuals treated the same way are called . A hidden factor that differs between groups is a variable. Results that agree with a hypothesis it.
Mia tested whether a sports drink improves sprint times. She ran 50 m once after drinking water on Monday morning and once after drinking the sports drink on Friday afternoon. Her time was 0.3 s faster on Friday. Evaluate her design and describe an improved experiment.
Mia's design isn't valid because the drink was not the only difference between the runs. Monday morning and Friday afternoon may differ in wind, temperature, how tired she was and how warmed up she was, and she may have improved simply from practising. Because she knew which drink she had, expecting the sports drink to work could have made her try harder (a placebo effect). It also isn't reliable: one run per drink, by one person, can't show whether 0.3 s is a real effect, since sprint times and hand timing easily vary by that much. Her conclusion isn't justified. An improved experiment would use 15–20 consenting volunteers who each run 50 m after the sports drink and after a placebo drink with the same colour and flavour but no electrolytes or sugar, on the same track, at the same time of day, on days with similar weather, with the same warm-up. The order of the drinks would be randomised and neither the runners nor the timer would know which drink was which. Each person would run three times per condition, timed with light gates, and the mean times compared. Volunteers with health conditions would not take part.