 Coaching Centre
Accuracy, precision and uncertainty
What accuracy, precision, reliability and validity mean, the resolution of instruments and reading uncertainty, absolute and percentage uncertainty, uncertainty from repeated trials, systematic and random errors, and percentage error, with a pendulum experiment to measure g.
In September 2011, physicists on the OPERA experiment announced that neutrinos fired from CERN, near Geneva, to a detector under Gran Sasso mountain in Italy, 730 km away, were arriving about 60 billionths of a second sooner than light could have. If true, it would have broken Einstein's theory of relativity. The team themselves asked other scientists to find their mistake. In 2012 they found it: a fibre-optic cable in the timing system wasn't plugged in properly. Every measurement had been shifted by the same amount. A tiny systematic error had produced a world-famous result.
Four words to get right
These terms appear in every evaluation question from now to the HSC, and they mean different things:
| Term | Meaning | Improved by |
|---|---|---|
| Accuracy | How close a measurement (or mean) is to the true or accepted value | Calibrated instruments; removing systematic errors |
| Precision | How close repeated measurements are to each other; also how finely an instrument can measure | Instruments with finer resolution; reducing random errors |
| Reliability | Whether repeating the investigation gives consistent results | Repeat trials, larger samples, others getting the same result |
| Validity | Whether the method actually tests what it claims to, so the conclusion is justified | Controlling variables, control groups, suitable method and equipment |
Results can be precise without being accurate: if the balance wasn't zeroed, every reading is 2 g too high, but they agree with each other beautifully. That is why repeating trials can show reliability but can't reveal every problem.
Resolution and reading uncertainty
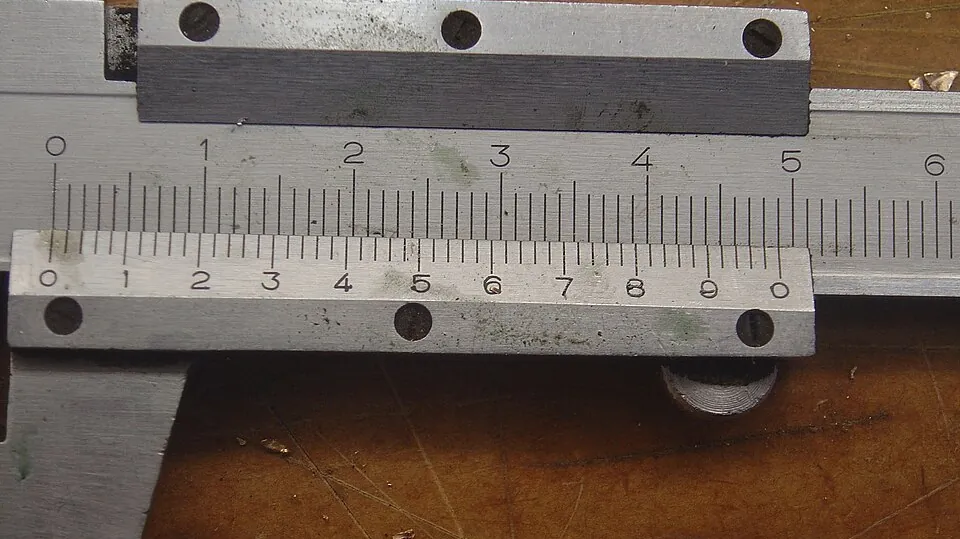
The resolution of an instrument is the smallest change it can show: 1 mm on a ruler, 0.01 g on a good balance, 0.1 mm on vernier calipers. No measurement is exact, so scientists write the uncertainty next to it, as a range the true value probably lies within.
A reading of 36.5 ± 0.5 mL means the true volume is probably between 36.0 and 37.0 mL. (Reading the meniscus at eye level was covered in Year 7, 1G.) Always record a measurement to the resolution of the instrument: write 20.0 cm, not 20 cm, if your ruler reads to 0.1 cm, because the zero carries information.
Percentage uncertainty
An uncertainty of 0.5 cm is huge when measuring a 2 cm beetle and tiny when measuring a 2 m table. To compare, use percentage uncertainty:
percentage uncertainty = (absolute uncertainty ÷ measured value) × 100%
The way to shrink it is to measure a bigger quantity. Time 10 swings of a pendulum rather than one; measure the thickness of 100 sheets of paper and divide by 100.
Your reaction time adds an uncertainty of about ± 0.2 s to any hand-timed reading. One swing of a pendulum takes about 1.6 s. Compare the percentage uncertainty in the period when you time one swing and when you time ten.
Uncertainty from repeated trials
When you repeat a measurement, the spread of the results tells you the uncertainty. A simple method suitable for Year 10 is to quote the mean ± half the range:
Five students time a ball rolling down the same ramp: 2.34 s, 2.41 s, 2.29 s, 2.38 s and 2.33 s. State the result with its uncertainty.
Round the mean to the same number of decimal places as the measurements: a calculator answer of 2.3500 s suggests a precision you don't have.
Systematic and random errors
In science, "error" doesn't mean a blunder. It means the difference between a measurement and the true value, and there are two kinds:
- Systematic errors push every result the same way by a similar amount: an unzeroed balance, a stretched tape measure, always reading a scale from above, a thermometer that reads 1 °C high. They reduce accuracy. Repeating doesn't help; you have to find and fix the cause, for example by calibrating against a known standard.
- Random errors make results scatter unpredictably above and below the true value: reaction time, estimating between scale marks, small draughts, natural differences between samples. They reduce precision. Repeating and averaging reduces their effect, as does measuring larger quantities.
Genuine mistakes, such as misreading a scale or writing 1392 instead of 1932, are neither. Spot them with your logbook and repeat that measurement.
Percentage error
When there is an accepted value to compare with, the percentage error measures accuracy:
percentage error = (experimental value − accepted value) ÷ accepted value × 100%
A pendulum 0.600 m long takes 15.70 s for 10 swings. Find g, and its percentage error compared with 9.80 m/s².
- With a hand stopwatch, time 1 swing per trial and do 5 trials. Note the uncertainty. Now try 10 swings per trial. What happens to the spread, and why?
- Switch to the light gate. Which kind of error has it removed?
- Measure the length to the top of the bob and do 10 trials. Is the result precise? Is it accurate? Will more trials fix it?
- Release from 45°. The equation g = 4π²L ÷ T² assumes small swings. What kind of error does a large swing cause?
Test yourself
A student's five measurements of the boiling point of water are 102.1, 102.0, 102.2, 102.1 and 102.0 °C. The accepted value is 100.0 °C. The results are
They agree closely with each other but are all about 2 °C high, suggesting a systematic error.
A measuring cylinder has 2 mL divisions. The uncertainty in a reading is
Half the smallest division: 2 ÷ 2 = 1 mL.
Which change reduces the effect of random error?
The others fix systematic errors.
A student measures the density of aluminium as 2.81 g/cm³. The accepted value is 2.70 g/cm³. The percentage error is about
(2.81 − 2.70) ÷ 2.70 × 100% = +4.1%.
Label the pendulum method.
Classify each source of error.
The smallest change an instrument can show is its . How close a result is to the accepted value is its . How close repeated results are to each other is their . An error that shifts every result the same way is a error. Uncertainty from repeated trials can be estimated as half the .
Two groups measure g with a pendulum. Group A times one swing per trial with a stopwatch and gets 8.9, 10.6, 9.4, 10.9 and 9.7 m/s². Group B times 20 swings per trial and gets 9.52, 9.55, 9.50, 9.54 and 9.53 m/s². The accepted value is 9.80 m/s². Compare the accuracy and precision of the two groups' results and explain the likely sources of error in each.
Group A's mean is (8.9 + 10.6 + 9.4 + 10.9 + 9.7) ÷ 5 = 9.9 m/s², close to 9.80, so their average is fairly accurate. But their results range from 8.9 to 10.9, an uncertainty of about ± 1.0 m/s², so they have low precision. This is random error: their reaction time (about 0.2 s) is large compared with one swing of about 1.6 s, giving an uncertainty of over 10% in each period, which is doubled in g because T is squared. Group B's results range only from 9.50 to 9.55 (± 0.03 m/s²), so they are very precise; timing 20 swings made the reaction-time error tiny in comparison. But their mean of 9.53 m/s² is about 2.8% below the accepted value, and every result is low, so there is a systematic error. Likely causes are measuring the length to the top of the bob instead of its centre, or releasing at a large angle, which makes the period longer. More trials won't fix it; they should measure to the centre of the bob and release from less than 10°.