 Coaching Centre
Measuring populations and biodiversity
What populations, communities and biodiversity are, and how ecologists estimate population size with quadrats, transects and capture–recapture, with worked examples.
Nobody has ever counted every grey-headed flying-fox in Australia. Instead, each February and May, volunteers stand outside hundreds of roosts at dusk and count the bats streaming out. From a few hundred samples, scientists estimate a national population of several hundred thousand, and can tell whether it is rising or falling.
Populations, communities and biodiversity
- A population is all the members of one species living in an area at the same time, such as all the koalas in a patch of forest.
- A community is all the populations of different species living and interacting in that area.
- Population size is how many individuals there are; population density is how many per unit area, such as 4 koalas per hectare. Distribution is where they are found.
- Biodiversity is the variety of life in an area. It includes the number of different species, the genetic variety within each species, and the variety of ecosystems.
Australia is one of about 17 "megadiverse" countries. Most of its mammals, reptiles, frogs and flowering plants are found nowhere else. Biodiversity matters because more diverse ecosystems are usually more stable: if one species declines, others can fill its role. It also gives us food, medicines and clean water, and it is central to the identity and law of First Nations peoples, whose kinship systems link people to particular plants and animals.
Sampling
Counting every individual is usually impossible, so ecologists count a sample and scale it up. A good sample is random (so you don't only sample the interesting spots) and large enough (more samples give a more reliable average).
Quadrats
A quadrat is a square frame, often 1 m × 1 m, placed at random positions in the study area. You count the individuals inside each one, find the average per quadrat, then multiply up to the whole area. Quadrats work for plants and slow-moving animals such as snails and barnacles.
Students count wiregrass tussocks in five 1 m² quadrats in a 50 m × 20 m paddock: 4, 7, 3, 6, 5. Estimate the population.
Transects
A transect is a line (a long tape measure) laid across an area where conditions change, such as from the low-tide mark up a rocky shore, or from a creek bank into dry woodland. You record what is touching the line, or place quadrats at regular intervals along it. Transects show how distribution changes with an abiotic factor such as height above water, shade or soil moisture.
Capture–recapture
Animals that move around can't be counted in quadrats. Instead:
- Trap a sample, mark each animal harmlessly (a dot of paint, an ear tag or a microchip) and release it.
- Wait for the marked animals to mix back into the population.
- Trap a second sample and count how many are marked.
The fraction marked in the second sample should equal the fraction marked in the whole population:
population size N = (number marked first time × number caught second time) ÷ number marked in second catch
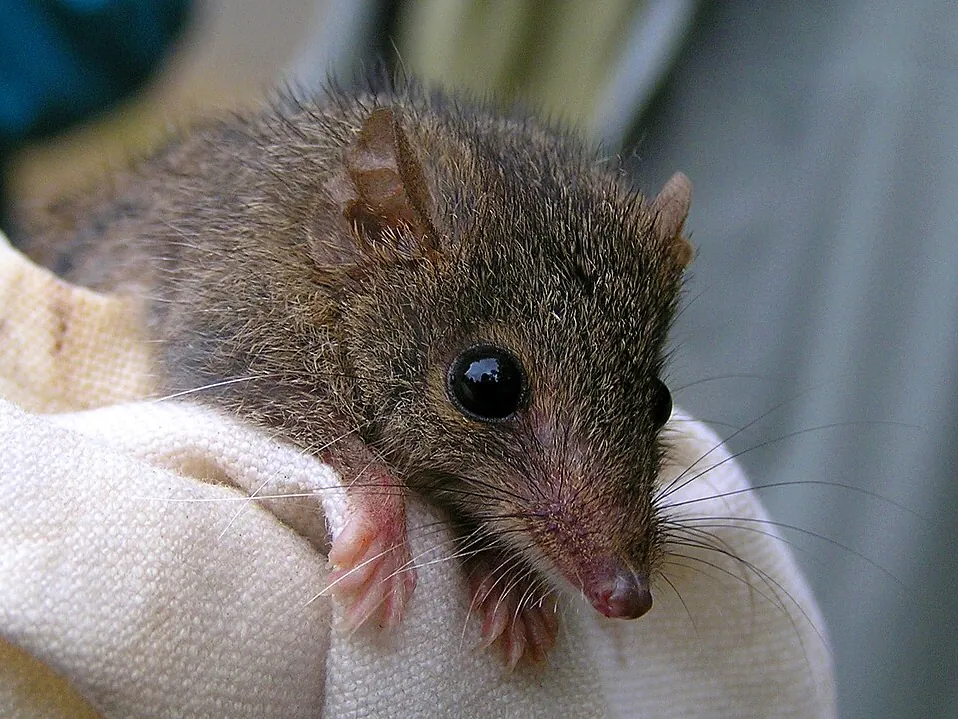
In a bushland reserve, 24 brown antechinus are trapped, marked and released. A week later 30 are trapped, and 8 of them are marked. Estimate the population.
This only works if marks don't fall off or make animals easier for predators to see, the marked animals mix evenly, and few animals are born, die or move away between samples. Some animals become "trap happy" (coming back for the bait) or "trap shy", which skews the result.
- Throw 3 quadrats and note the estimate. Then throw 10 more. Which estimate is closer to the true number?
- Try a new site where the plants are clumped. Why is it harder to get a good estimate?
- Switch to capture–recapture. Run it three times. Why does the estimate change each time?
- What would happen to the estimate if half the paint marks washed off before the second night?
Newer methods
Ecologists now also use motion-sensing camera traps, which photograph animals day and night without disturbing them; drones with heat cameras, which can spot koalas in treetops at night; acoustic recorders that identify frogs and birds by their calls; and environmental DNA (eDNA), where a water sample is tested for tiny traces of DNA shed by animals. eDNA has been used to find platypus in creeks where nobody had seen one for years. Citizen scientists help too, by logging sightings in apps such as iNaturalist and FrogID.
Indigenous rangers combine these tools with knowledge of tracks, scats, seasons and where animals shelter. Ranger groups across northern and central Australia run many of the country's surveys of threatened species such as the bilby and the night parrot.
Test yourself
Which method is best for estimating the number of snails along a line from a creek to a dry hillside?
A transect shows how numbers change as conditions change.
40 possums are marked and released. Later 50 are caught, 10 of them marked. The estimated population is
40 × 50 ÷ 10 = 200.
Quadrats should be placed randomly so that
Random placement stops you picking the "best" spots.
The average count in 1 m² quadrats is 3 daisies. The field is 200 m². The estimate is
3 × 200 = 600.
Name each sampling method.
Put the capture–recapture method in order.
All the members of one species in an area form a . The number per unit area is the population . A square frame used to sample plants is a . A line used to sample across changing conditions is a . The variety of living things in an area is called .
A student throws two quadrats in a 500 m² field, finds 2 and 12 plants, and estimates 3500 plants. Explain why this estimate may be unreliable and describe how to improve the method.
Two quadrats is far too small a sample. The counts (2 and 12) are very different, which suggests the plants are clumped, so the average of 7 per m² may be well above or below the true average for the field. The estimate depends heavily on where the two quadrats happened to land. To improve it, the student should use many more quadrats (for example 20), place each one at random coordinates chosen with a random number generator rather than by eye, calculate the mean of all the counts and multiply by the field's area of 500 m². Combining results with other students would make the average even more reliable.