 Coaching Centre
Resistance and I–V characteristics
Resistance as R = V/I, Ohm's law and ohmic conductors, how length, area, material (resistivity) and temperature affect resistance, the I–V characteristics of resistors, filament globes, diodes, LEDs and thermistors, and the mandatory Ohm's law investigation.
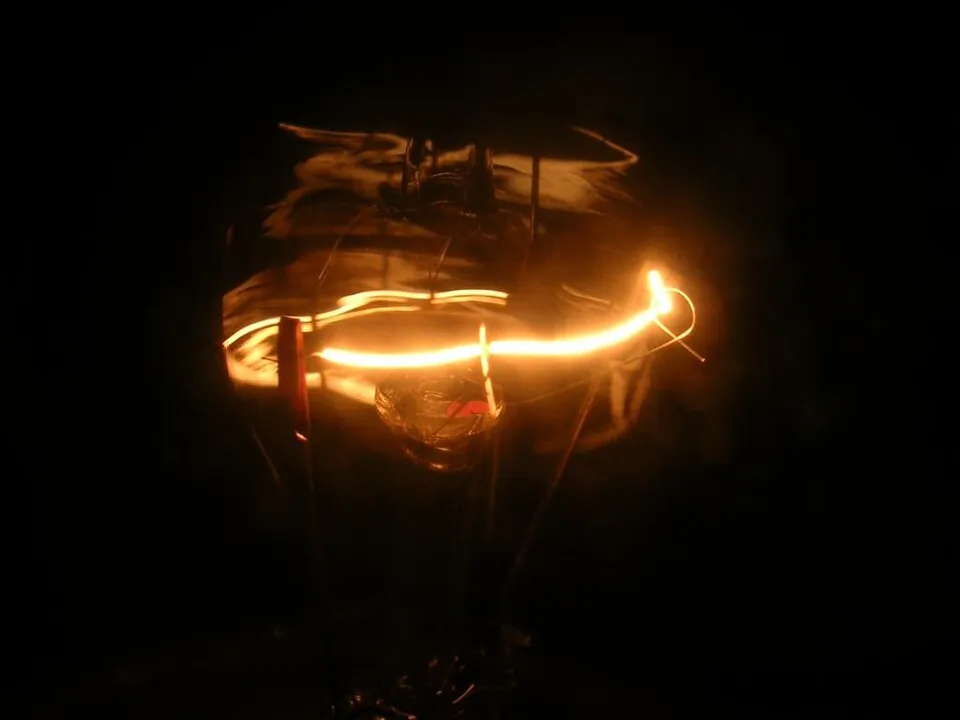
An old-style 60 W globe has a resistance of about 900 Ω when it glows. Measure it with a multimeter while it is cold on the bench and you'll get something closer to 70 Ω. Same tungsten, same length, same thickness, yet the resistance has changed by a factor of more than ten. Ohm's law is one of the most used equations in physics, and one of the most misunderstood: it describes some components beautifully and others not at all.
Resistance
The resistance of a component is the potential difference across it divided by the current through it:
$$R = \frac{V}{I} \qquad\text{or}\qquad V = IR$$
The unit is the ohm (Ω), one volt per ampere. A large resistance means a lot of potential difference (energy per coulomb) is needed to push each ampere through. In a metal, resistance comes from free electrons colliding with the vibrating lattice ions and with impurities and defects; each collision transfers energy to the lattice as heat.
Year 9 (topic 6E) used V = IR with fixed resistors. At Stage 6 the important point is that R = V/I defines resistance at any operating point, for any component. It does not claim that R is constant.
Ohm's law and ohmic conductors
Ohm's law states that the current through a conductor is directly proportional to the potential difference across it, provided the temperature (and other physical conditions) stay constant. A component that obeys it is ohmic: its I–V graph is a straight line through the origin, and its resistance is the same at every voltage. Metal-film resistors and metal wires kept at constant temperature are ohmic. Components whose I–V graph is not a straight line through the origin are non-ohmic.
For an ohmic conductor, the gradient of an I–V graph is 1/R, and the gradient of a V–I graph (V on the vertical axis) is R. For a non-ohmic component, find the resistance at a particular point by reading V and I and dividing; the gradient of the tangent is not the resistance.
What sets the resistance?
- Length: a longer wire means more collisions on the way through. R ∝ L.
- Cross-sectional area: a thicker wire offers more parallel paths. R ∝ 1/A.
- Material: captured by the resistivity ρ, in Ω m.
- Temperature: in metals, hotter ions vibrate more and scatter electrons more, so R rises. In semiconductors, heat frees many more charge carriers, so R falls.
$$R = \frac{\rho L}{A}$$
| Material | Resistivity at 20 °C (Ω m) | Typical use |
|---|---|---|
| Silver | 1.6 × 10⁻⁸ | Best conductor, used in some contacts |
| Copper | 1.7 × 10⁻⁸ | House wiring, circuit boards |
| Aluminium | 2.8 × 10⁻⁸ | Overhead transmission lines (light) |
| Nichrome | 1.1 × 10⁻⁶ | Heating elements in toasters and kettles |
| Silicon (pure) | about 2 × 10³ | Semiconductor devices |
| Glass | 1010 to 1014 | Insulators |
A toaster element is made from 2.0 m of nichrome wire 0.50 mm in diameter. Find its resistance at room temperature. (ρ = 1.1 × 10⁻⁶ Ω m)
$A = \pi r^2 = \pi(0.25 \times 10^{-3})^2 = 1.96 \times 10^{-7}$ m2.
$R = \dfrac{\rho L}{A} = \dfrac{(1.1 \times 10^{-6})(2.0)}{1.96 \times 10^{-7}} = 11$ Ω.
Doubling the diameter would quarter the area and the resistance. Nichrome is used because its resistivity is high and it barely changes with temperature, and it doesn't oxidise when red hot.
I–V characteristics of common components
- Ohmic resistor: a straight line through the origin, the same in both directions. R is constant.
- Filament globe: as the current rises the filament heats (to about 2500 °C), the ions vibrate more and R increases. The graph curves towards the V axis and is symmetrical for reversed voltage.
- Diode: conducts in one direction only. In reverse, essentially no current flows. In the forward direction almost nothing flows until the threshold (about 0.6–0.7 V for silicon), then the current rises steeply. A resistor is always put in series to limit the current.
- LED: a diode that emits light, with a higher threshold voltage that depends on the colour (about 1.8 V for red, around 3 V for blue).
- Thermistor (NTC): a semiconductor whose resistance falls as its temperature rises. At a fixed temperature it is ohmic; if it heats as current flows, the graph curves away from the V axis. Used as a temperature sensor in fridges, cars and digital thermometers.
A 6.0 V filament globe draws 0.17 A at 1.0 V, 0.33 A at 3.0 V and 0.50 A at 6.0 V. Find its resistance at each voltage and explain the trend.
$R = V/I$: 1.0/0.17 = 5.9 Ω; 3.0/0.33 = 9.1 Ω; 6.0/0.50 = 12 Ω.
R rises with voltage because the larger current heats the tungsten. The hotter lattice ions vibrate with greater amplitude and scatter the drifting electrons more often, so a larger potential difference is needed per ampere. The globe is non-ohmic because its temperature does not stay constant.
- Resistor at +3.0 V: 30.0 mA and R = 100 Ω. Press "Sweep −6 V to +6 V" to draw its straight-line graph.
- Filament globe: at 1.0 V the current is 171 mA and R = 5.9 Ω; at 6.0 V it is 500 mA and R = 12 Ω. Sweep to see the curve.
- Silicon diode at +3.0 V supply: only 0.83 V sits across the diode (the rest is across the protective resistor) and 21.7 mA flows. Set −3.0 V: no current.
- Red LED at +3.0 V supply: 1.91 V across it and 10.9 mA. Compare its threshold with the silicon diode's on the swept graphs.
- Thermistor at 25 °C: R = 1000 Ω and the line is straight. Raise the temperature to 50 °C: R = 359 Ω and the line gets steeper.
Test yourself
A wire has resistance 8.0 Ω. A second wire of the same metal is twice as long and has twice the diameter. Its resistance is
R ∝ L/A. Doubling L doubles R; doubling d multiplies A by 4, dividing R by 4. Net factor ½: 4.0 Ω.
The I–V graph of a component is a straight line that passes through the origin. This shows that the component
I ∝ V means a constant R: the definition of an ohmic conductor.
The resistance of a filament globe increases as the potential difference across it increases because
Heating increases the amplitude of the ions' vibrations, increasing the rate of electron–ion collisions.
At 2.0 V a diode carries 25 mA. Its resistance at this point is
R = V/I = 2.0/0.025 = 80 Ω.
Which component would be most suitable as the sensor in an electronic thermometer?
A thermistor's resistance changes greatly and predictably with temperature.
Match each description to its I–V graph.
Sort the components (as normally used).
Resistance is defined as the potential difference divided by the and is measured in . The resistance of a wire is proportional to its and inversely proportional to its cross-sectional . In a metal, resistance as temperature rises. A component whose I–V graph is a straight line through the origin is called .
A student measures the current through a component at different potential differences and obtains: 0 V, 0 A; 1.0 V, 0.10 A; 2.0 V, 0.16 A; 4.0 V, 0.24 A; 6.0 V, 0.30 A. (a) Calculate the resistance at 1.0 V and at 6.0 V. (b) Identify the component, justifying your answer. (c) Explain how the experimental method should be designed so that the results are valid and reliable.
(a) At 1.0 V: R = V/I = 1.0/0.10 = 10 Ω. At 6.0 V: R = 6.0/0.30 = 20 Ω.
(b) The resistance increases as the potential difference increases, so the component is non-ohmic and its I–V graph curves towards the V axis. This matches a filament globe: the larger current heats the filament, increasing the vibration of the metal ions and the rate at which drifting electrons are scattered.
(c) Validity: the ammeter must be in series and the voltmeter connected across the component only, so that the measured values are those of the component; only the supply voltage should be changed; meters should be on ranges that give at least two significant figures; for testing Ohm's law on a resistor, readings should be taken quickly with the switch opened in between so that heating does not become an uncontrolled variable. Reliability: each set of readings should be repeated (at least three times) and averaged, with more data points over the full range, including reversed polarity, so the shape of the graph is clearly established.