 Coaching Centre
Why we monitor the environment
Why chemists monitor ions in water, soil and living things: heavy metals, nutrients and acid drainage, bioaccumulation and biomagnification, guideline values, ppm and ppb conversions, and Australian case studies.
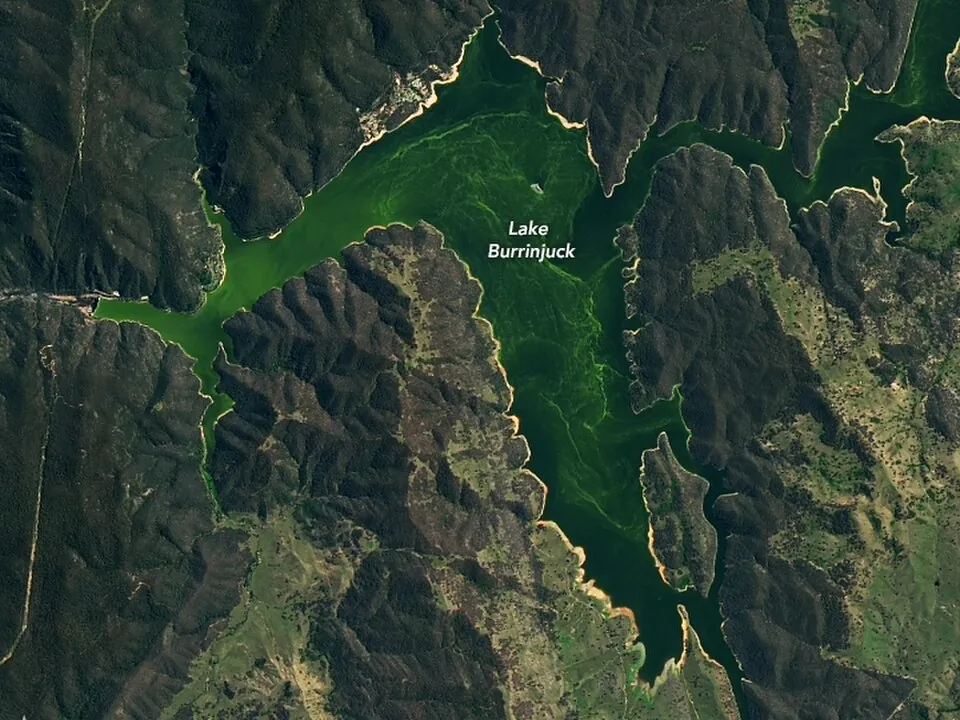
In 1991 a bloom of toxic blue-green algae stretched for about 1000 km along the Barwon–Darling River. Stock died after drinking the water, towns had to find other supplies and the state declared an emergency. The algae were fed by phosphorus washing off farms and out of sewage works, in a river slowed by drought. Nobody had been measuring closely enough to see it coming. That is the case for environmental monitoring in one sentence: you can't manage what you don't measure.
Why monitor?
Natural waters always contain dissolved ions: Na⁺, Ca²⁺, Mg²⁺, Cl⁻, HCO₃⁻ and SO₄²⁻ from weathered rock, and small amounts of nitrate and phosphate from decaying matter. Human activity changes the amounts, sometimes by a factor of a thousand. Chemists monitor the environment to:
- protect human health: drinking water, food and air must stay below safe limits for toxic species such as lead, arsenic, mercury and nitrate;
- protect ecosystems: fish and invertebrates are often far more sensitive than people, so ecosystem guideline values are much lower than drinking-water limits;
- check that industry and agriculture follow their licences: mines, smelters, sewage plants and factories must report what they release, and regulators such as the NSW EPA check;
- establish a baseline, so that a change can be detected early and traced to its source;
- judge whether a clean-up or new rule is working.
What are we looking for?
| Pollutant | Main sources | Why it matters |
|---|---|---|
| Heavy metal ions: Pb²⁺, Hg²⁺, Cd²⁺, Cu²⁺, Zn²⁺, arsenic | mining and smelting, old lead paint and petrol residues, industry, stormwater | toxic in tiny amounts; bind to enzymes and disrupt them; lead damages the developing brain; many accumulate in organisms |
| Nitrate (NO₃⁻) and phosphate (PO₄³⁻) | fertiliser run-off, sewage effluent, animal waste, detergents | feed algal blooms (eutrophication); when the algae die, decomposing bacteria use up the dissolved oxygen and fish suffocate; nitrate in drinking water is dangerous for babies |
| H⁺ (low pH) | acid mine drainage, acid sulfate soils | kills aquatic life directly and keeps toxic metals dissolved |
| Na⁺ and Cl⁻ (salinity) | rising water tables after land clearing, irrigation | kills crops and freshwater species |
Acid mine drainage forms when sulfide minerals such as pyrite in waste rock react with air and water: $4\text{FeS}_2 + 15\text{O}_2 + 14\text{H}_2\text{O} \rightarrow 4\text{Fe(OH)}_3 + 8\text{H}_2\text{SO}_4$. The sulfuric acid dissolves metals out of the rock, which is why low pH and high copper, zinc and lead usually turn up together below old mines.
Bioaccumulation and biomagnification
Some pollutants are taken up faster than they are excreted, so their concentration in an organism rises over its life (bioaccumulation). Methylmercury and some organic pollutants are stored in fat and muscle. When a predator eats many contaminated prey, it collects all of their load, so the concentration rises at each step of the food chain (biomagnification). This is why large predatory fish such as shark and swordfish carry the most mercury, and why Food Standards Australia New Zealand advises pregnant women to limit how often they eat them.
Guideline values and units
Australia's limits come from the Australian Drinking Water Guidelines (NHMRC) for drinking water, and the ANZG water quality guidelines for rivers, lakes and the sea. Concentrations in the environment are tiny, so they are given in mass per litre:
- 1 mg/L is about 1 part per million (ppm) in water, because 1 L of water has a mass of about 1 kg = 10⁶ mg;
- 1 µg/L is about 1 part per billion (ppb).
For example, the drinking-water guideline for lead is 0.01 mg/L (10 ppb), but the ecosystem guideline for lead in fresh water is about 3.4 µg/L, and for copper about 1.4 µg/L. To compare with a calculation in mol/L, convert using the molar mass.
A sample of bore water contains 2.4 × 10⁻⁷ mol/L of Pb²⁺. Does it meet the drinking-water guideline of 0.01 mg/L?
- Choose copper. Compare the upstream site with Site 1. How many times higher than the ecosystem guideline is the copper at Site 1?
- Switch to pH at Site 1. Explain how the low pH and the high copper are connected.
- Choose phosphorus and turn on "after heavy rain". Which site changes most, and what is the most likely source?
- Copper at Site 1 meets the drinking-water guideline but not the ecosystem guideline. Why are the two values so different?
Australian case studies
Port Pirie, South Australia. A lead smelter has operated at Port Pirie since 1889, and is now one of the largest in the world. Lead dust settles on homes and playgrounds, and children absorb lead more easily than adults. SA Health has tested children's blood lead for decades; levels have fallen a long way, but many young children are still above the national investigation level of 5 µg/dL. Monitoring data drove a smelter rebuild, dust-control programs and home clean-ups.
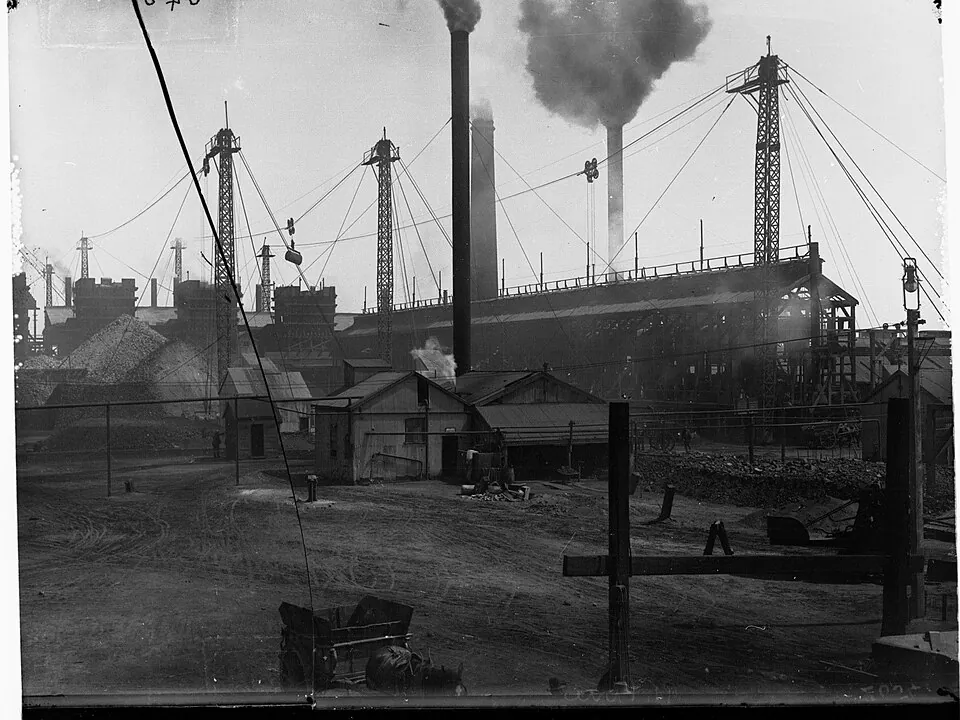
Old mine sites. Abandoned mines such as Captains Flat (NSW) and Mount Morgan (Queensland) released acid and metals into rivers for decades after mining stopped. Monitoring upstream and downstream shows whether remediation, such as capping waste dumps and treating drainage with lime, is working.
Caring for Country. Indigenous ranger groups across Australia sample rivers, billabongs and springs on their Country and combine the results with long-term knowledge of how the water should look, smell and behave and which plants and animals should be there. Their data feeds into decisions about mining, water allocation and fire management.
Test yourself
A river contains 0.0035 mg/L of cadmium. In parts per billion this is
1 mg/L ≈ 1 ppm = 1000 ppb, so 0.0035 × 1000 = 3.5 ppb.
Which observation is the best evidence of acid mine drainage below an abandoned copper mine?
Oxidised sulfide minerals make sulfuric acid, which dissolves metals.
Mercury concentrations are highest in large predatory fish mainly because of
Each predator collects the mercury from many prey.
Phosphate entering a lake most directly leads to
Phosphate is a limiting nutrient for algae. Decomposing algae use up oxygen.
Label the sources in the catchment.
Classify each pollutant.
The build-up of a pollutant in one organism over its lifetime is . The increase in concentration from prey to predator is . A concentration of 1 µg/L in water is about 1 part per . Acid mine drainage forms when minerals react with oxygen and water.
A council plans a new housing estate beside a creek that runs past an old lead mine. Analyse the need to monitor the creek, and outline a monitoring plan.
Water draining old lead workings is likely to be acidic and carry dissolved Pb²⁺ and other metals such as Zn²⁺ and Cu²⁺, because oxidised sulfide minerals produce sulfuric acid that dissolves metals from waste rock. Lead is toxic to people, especially children, and metals are toxic to aquatic life at µg/L levels and can bioaccumulate and biomagnify in fish and birds. The new estate will add stormwater carrying nutrients, sediment and metals from roads. Monitoring is needed to establish a baseline before construction, to check that the creek meets the Australian Drinking Water Guidelines and ANZG ecosystem values, and to detect any change early and trace it to the mine or the estate.
A sensible plan: sample at least three sites (upstream of the mine, between the mine and the estate, and downstream of the estate) monthly, and also after heavy rain when run-off is greatest. Measure pH on site with a calibrated meter, determine lead and zinc by atomic absorption spectroscopy against a calibration curve, and measure phosphate and nitrate by colorimetry. Compare each result with the guideline values and with the upstream reference site.