 Coaching Centre
Colorimetry, UV-visible spectrophotometry and AAS
Measuring concentration from absorbed light: the Beer–Lambert law, colorimeters and UV-visible spectrophotometers, atomic absorption spectroscopy and its Australian invention, and how to make and use a calibration curve.
In 1952 a physicist at CSIRO in Melbourne was working in his garden on a Sunday morning when an idea struck him: chemists measured metals by the light their atoms emit, but it should be far better to measure the light they absorb. He went to work the next day and tried it. Within a few years his idea was in laboratories around the world, and it is now used to check lead in children's blood, copper in drinking water and gold in ore samples.
Absorbance and concentration
When light passes through a solution, particles that can absorb that wavelength take some of it. The more particles in the light's path, the less light gets through. Instruments measure the absorbance, $A$, which is defined so that it rises in proportion to concentration:
$A = \log_{10}\dfrac{I_0}{I}$ and $A = \varepsilon l c$ (the Beer–Lambert law)
Here $I_0$ is the intensity entering the sample and $I$ the intensity leaving it, $l$ is the path length (usually 1.00 cm), $c$ is the concentration and $\varepsilon$ is a constant for that substance at that wavelength. An absorbance of 1 means only 10% of the light gets through; 2 means only 1%. In practice you rarely use $\varepsilon$ directly: you measure standards and draw a calibration curve.
Colorimetry and UV-visible spectrophotometry
A coloured solution looks the colour it does because it absorbs the complementary colour. Copper(II) sulfate looks blue because it absorbs orange-red light, so you measure it with an orange or red filter (around 620–800 nm). Measuring at the wavelength of maximum absorbance, $\lambda_{max}$, gives the steepest calibration curve, which means the best sensitivity.
- A colorimeter uses a coloured filter or LED, so it selects a broad band of wavelengths. It is cheap, portable and good enough for field tests of phosphate or nitrate in water.
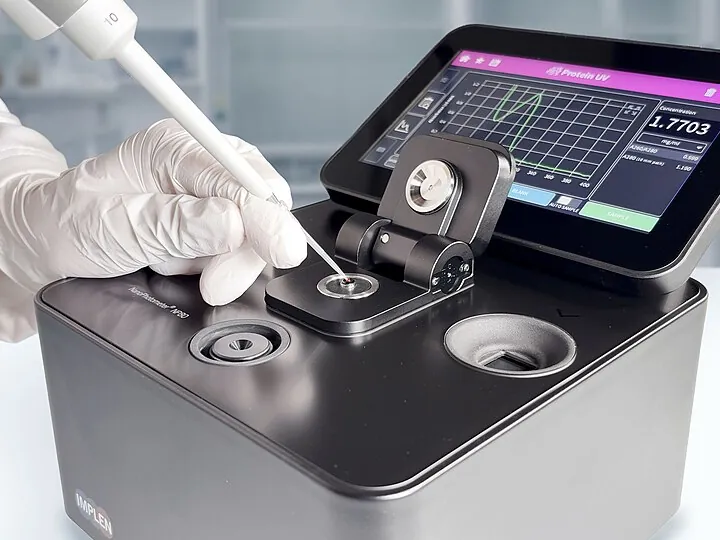
- A UV-visible spectrophotometer uses a monochromator (a diffraction grating) to choose a narrow band at any wavelength from about 190 to 800 nm. It can scan to find $\lambda_{max}$, and it can measure colourless substances that absorb ultraviolet light, such as proteins at 280 nm or DNA at 260 nm.
Colourless metal ions can often be measured by adding a reagent that forms a coloured complex: Fe³⁺ with thiocyanate (blood red), or phosphate with molybdate and a reducing agent (molybdenum blue).
Atomic absorption spectroscopy (AAS)
In 8B you saw that a hot atom emits light at energies that match the gaps between its electron energy levels. The same atom in its ground state can absorb exactly those energies. AAS uses this:
- The sample solution is sprayed (nebulised) into a flame, usually air–acetylene at about 2300 °C. The heat breaks compounds into free, gaseous atoms.
- A hollow cathode lamp, with a cathode made of the element being measured, shines light through the flame. It emits exactly the wavelengths that atoms of that element absorb.
- A monochromator selects one strong line (for example 324.8 nm for copper or 217.0 nm for lead), and a detector measures how much of it is absorbed.
Because the lamp emits only lines that the chosen element can absorb, other metals in the sample hardly interfere. That makes AAS very selective. It is also very sensitive, measuring many metals down to about 0.01–1 mg/L (and much lower with an electrically heated graphite furnace instead of a flame). Its limitation is that it measures one element at a time, and the lamp must be changed for each.
An Australian invention
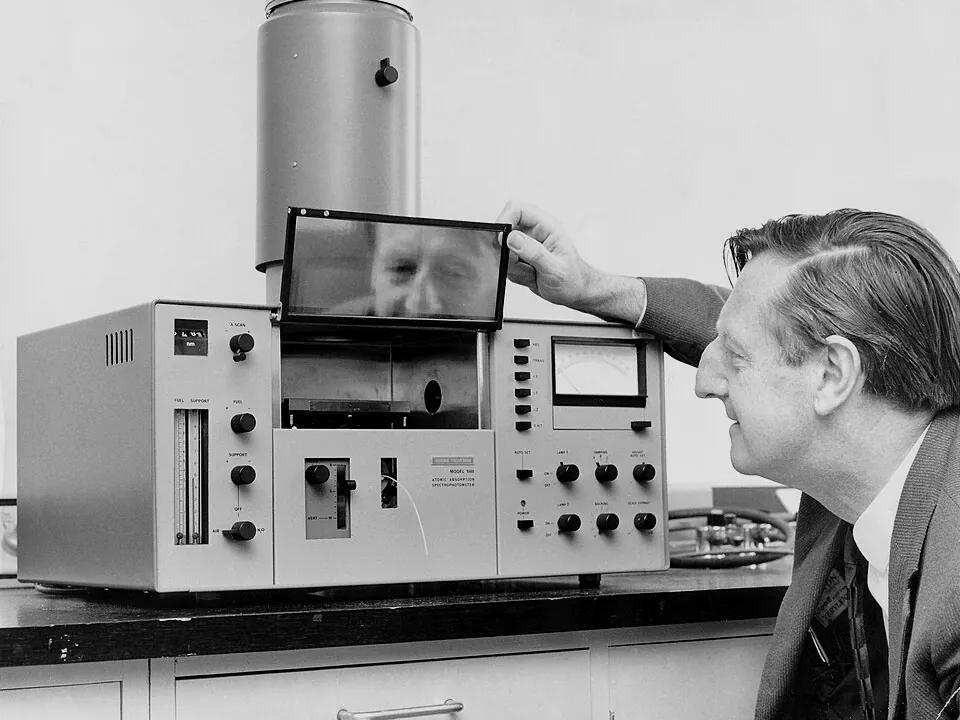
Alan Walsh (1916–1998) was born in England and joined CSIRO's Division of Chemical Physics in Melbourne in 1946. Emission methods for metals were unreliable, because only a tiny fraction of atoms in a flame are excited enough to emit, and that fraction changes with every small change in flame temperature. Walsh realised in 1952 that most atoms in a flame stay in the ground state, so measuring absorption by those ground-state atoms would be far more sensitive and stable. The problem was that ordinary light sources gave lines too broad to measure the very narrow atomic absorption lines. His solution was a lamp made of the same element, so its emission lines exactly match the absorption lines.
Walsh's team published the method in 1955 and built prototype instruments. Melbourne companies made the first commercial instruments in the early 1960s, and AAS spread into mining, agriculture, medicine and environmental testing. Walsh was elected a Fellow of the Royal Society and knighted in 1977. AAS remains one of Australia's most successful scientific exports.
Calibration curves
All three methods use the same steps:
- Prepare a blank (solvent only) and a series of standard solutions of known concentration, usually by dilution of a stock solution. The standards should cover the range expected in the sample.
- Zero the instrument with the blank, then measure the absorbance of each standard.
- Plot absorbance (y) against concentration (x) and draw the line of best fit.
- Measure the sample and read its concentration from the line (interpolation). Multiply by any dilution factor.
The line is only reliable within the range of the standards. At high concentrations the response usually bends towards the x-axis, so a reading above the highest standard (extrapolation) underestimates the concentration. The fix is to dilute the sample until it reads inside the range.
Lead standards of 0, 2.0, 4.0, 6.0, 8.0 and 10.0 mg/L gave a straight-line calibration with a slope of 0.042 absorbance units per mg/L, passing through the origin. A water sample was diluted 5.00 mL to 50.00 mL before measurement and gave an absorbance of 0.236. Calculate the lead concentration in the original water.
- With the Cu lamp, measure the standards, then measure the tap water (sample 1). It should read close to 1.6 mg/L, inside the calibrated range.
- Now measure the mine water (sample 2) undiluted. The reading falls above the highest standard and the sim warns you. Dilute it ×10 and measure again: the original concentration comes out close to 22 mg/L. How far off was the undiluted reading?
- Switch on "Wrong lamp fitted" and measure the standards. Explain why every absorbance is almost zero.
- Use the Pb lamp on the paint flake extract. Which setting gives a trustworthy answer, and what is it?
Test yourself
Why does AAS use a lamp made of the same element that is being measured?
Ground-state atoms absorb only the energies that match their own energy gaps, the same lines the lamp emits.
A solution of nickel(II) ions is green. Which colour of light should a colorimeter use to measure it?
Green solutions absorb red light most strongly, so red gives the steepest calibration line.
A sample gives an absorbance higher than that of the most concentrated standard. The best response is to
The response may not be linear above the highest standard, so extrapolation is unreliable.
A calibration line for iron has a slope of 0.125 per mg/L and passes through the origin. A sample diluted 10.0 mL to 100.0 mL has an absorbance of 0.450. The iron concentration in the original sample is
0.450 ÷ 0.125 = 3.6 mg/L in the diluted solution; × 10 = 36 mg/L.
Name each part of the atomic absorption spectrometer.
Put the steps for finding a metal concentration by AAS in order.
The Beer–Lambert law states that absorbance is directly proportional to . In AAS the sample is turned into free atoms in a . Reading a concentration between two standards is called . AAS was invented by Alan at CSIRO.
Copper standards measured by AAS gave the results below. A 25.0 mL sample of mine run-off was diluted to 250.0 mL and gave an absorbance of 0.274.
| Cu (mg/L) | 0 | 1.0 | 2.0 | 3.0 | 4.0 | 5.0 |
|---|---|---|---|---|---|---|
| Absorbance | 0.000 | 0.110 | 0.221 | 0.329 | 0.441 | 0.548 |
(a) Determine the copper concentration in the run-off. (b) Explain why AAS is suited to this analysis, and why the sample was diluted.
(a) The standards lie on a straight line through the origin with slope ≈ 0.548 ÷ 5.0 = 0.110 per mg/L. The diluted sample: $c = 0.274 \div 0.110 = 2.5$ mg/L. The dilution factor is 250.0 ÷ 25.0 = 10, so the run-off contains 25 mg/L of copper.
(b) AAS uses a copper hollow cathode lamp, whose emission lines are absorbed only by copper atoms, so other metals in the run-off (iron, zinc and so on) do not interfere: the method is selective. Most atoms in the flame are in the ground state and can absorb, so it can detect copper at very low concentrations. The undiluted run-off would have an absorbance of about 2.7, far above the highest standard, where the response is no longer linear and the result would be unreliable. Diluting by a known factor brings the reading into the calibrated range, and multiplying by 10 gives the original concentration.