 Coaching Centre
What starlight reveals
How a star's spectrum gives its surface temperature (Wien's law), chemical composition, motion towards or away from us (Doppler shift), rotation, and the density of its atmosphere and so its luminosity class.
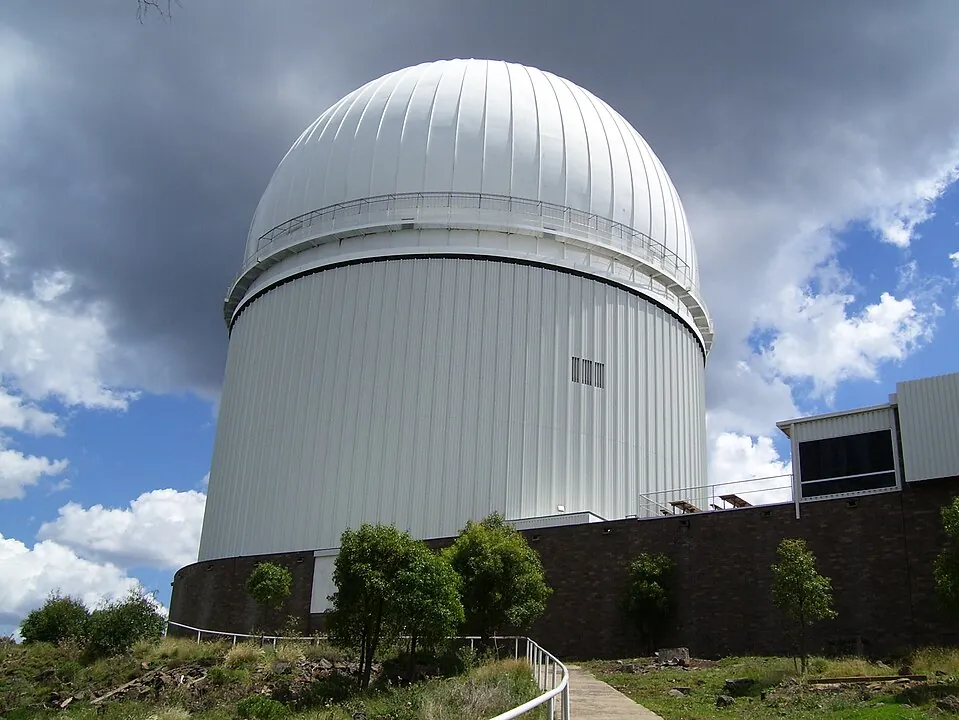
At Siding Spring Observatory near Coonabarabran, the 3.9 m Anglo-Australian Telescope can collect the spectra of 400 stars at once. Its GALAH survey has measured the chemical make-up of nearly a million stars in our galaxy, element by element, so astronomers can sort them into families born in the same gas cloud billions of years ago. Every one of those results came from light that has travelled for hundreds or thousands of years, split into its wavelengths.
Anatomy of a stellar spectrum
A star's dense, hot interior emits a continuous spectrum. Its cooler, thinner outer atmosphere absorbs particular wavelengths, so starlight reaching us is an absorption spectrum: a continuous curve with dark lines. Four different features of that spectrum carry four different kinds of information.
1. Surface temperature: the peak
A star's continuous spectrum is close to a black-body curve (7H). Hotter stars peak at shorter wavelengths, given by Wien's displacement law:
$$\lambda_{max} = \frac{b}{T}, \qquad b = 2.898 \times 10^{-3} \text{ m K}$$
So colour indicates temperature: red stars are cool (about 3000 K), yellow stars like the Sun are about 5800 K, and blue-white stars are 10 000 K or more. Astronomers also use which absorption lines are strong, because that depends sensitively on temperature. That gives the spectral classes O, B, A, F, G, K, M from hottest to coolest:
| Class | Temperature (K) | Colour | Strongest lines |
|---|---|---|---|
| O | > 30 000 | blue | ionised helium |
| B | 10 000–30 000 | blue-white | neutral helium, hydrogen |
| A | 7500–10 000 | white | hydrogen (strongest of all) |
| F | 6000–7500 | yellow-white | hydrogen, ionised calcium |
| G | 5200–6000 | yellow | ionised calcium, metals |
| K | 3700–5200 | orange | metals, calcium |
| M | < 3700 | red | titanium oxide molecular bands |
Hydrogen lines are weak in very hot stars (the hydrogen is ionised) and in cool stars (too few electrons are in the n = 2 level that produces the visible lines). That is why line patterns change so much with temperature, even though most stars are about three-quarters hydrogen.
The spectrum of Betelgeuse peaks at about 805 nm. Calculate its surface temperature and predict its colour.
2. Chemical composition: which lines
Each element absorbs its own set of wavelengths (7C). Matching a star's absorption lines with laboratory spectra shows which elements are in its atmosphere, and the strength of the lines (once temperature is allowed for) shows how much of each there is. Astronomers call every element heavier than helium a "metal". Old stars, formed before many generations of supernovae enriched the galaxy, are metal-poor and have weak metal lines for their temperature.
3. Translational velocity: line shifts
If a star is moving towards or away from us, every line is Doppler shifted. Moving away stretches the waves: lines move to longer wavelengths (redshift). Moving towards us: shorter wavelengths (blueshift). For speeds much less than $c$,
$$\frac{\Delta\lambda}{\lambda} = \frac{v}{c}$$
This gives only the radial velocity, the part of the motion along our line of sight. Movement across the sky causes no shift. The same idea, applied to the tiny back-and-forth wobble of a star tugged by an orbiting planet, has found over a thousand exoplanets, and applied to distant galaxies it shows the universe is expanding (Module 8).
In the spectrum of Barnard's star, the hydrogen-alpha line (laboratory wavelength 656.28 nm) is observed at 656.04 nm. Find the star's radial velocity.
4. Rotation and density: line widths
Rotation. When a star spins, one edge (limb) moves towards us and the other away. Light from the approaching limb is blueshifted, from the receding limb redshifted, and from the middle unshifted. Added together, each line is spread out into a broad, shallow line. The faster the rotation, the wider the lines. If the star's lines periodically split into two, it is a spectroscopic binary: two stars orbiting each other.
Density. In a dense atmosphere, atoms collide often and their energy levels are disturbed, which broadens the lines (pressure broadening). A main-sequence dwarf, being small and compact, has a dense atmosphere and broad lines. A giant or supergiant, with the same temperature, has a huge, tenuous atmosphere and much narrower lines. So line width tells you the luminosity class: dwarf (V), giant (III) or supergiant (I). Combined with spectral class this places the star on the Hertzsprung–Russell diagram and gives its true brightness, which in turn gives its distance.
- Start with the Sun. Read $\lambda_{max}$ and check it with $\lambda_{max} = b/T$. Which absorption lines are strongest?
- Choose Vega, then Betelgeuse. How do the peak and the pattern of lines change between a hot A star and a cool M star?
- Choose Barnard's star. Read the observed Hα wavelength and calculate the radial velocity yourself. Does it match the readout?
- Compare Altair with Vega in the zoom panel. What makes Altair's lines so broad and shallow?
- Choose Arcturus, then switch the luminosity class to dwarf and back to giant. What changes, and why? Then turn off Metal-poor. What does Arcturus's real spectrum suggest about its age?
- Choose the mystery star. Work out its class, radial velocity, luminosity class and metal content before you press Reveal.
Test yourself
A star's spectrum peaks at 290 nm. Its surface temperature is about
$T = 2.898 \times 10^{-3} / 290 \times 10^{-9} = 9990$ K.
All lines in a star's spectrum are shifted 0.10% towards longer wavelengths. The star is
$v = c\Delta\lambda/\lambda = 3.00 \times 10^8 \times 0.0010 = 3.0 \times 10^5$ m/s, redshift so receding.
Two stars have the same spectral class. Star X has much narrower absorption lines than star Y. The best explanation is that X
Less pressure broadening means a less dense atmosphere, typical of giants.
Which property of a star can NOT be found from its spectrum alone?
Doppler shifts only measure motion along the line of sight.
What does each feature tell you?
Match the spectral evidence to what it reveals.
Starlight forms an spectrum. A cooler star has its peak at a wavelength. A star moving towards us shows a . Fast rotation makes absorption lines . Narrow lines show a low- atmosphere.
An astronomer records the spectrum of a star. Outline how each of the following can be determined from the spectrum: surface temperature, chemical composition, translational velocity, rotational velocity and density. Include one relevant equation.
Temperature: the continuous spectrum approximates a black body, so the peak wavelength gives the surface temperature through Wien's law, $T = b/\lambda_{max}$; the pattern of absorption lines also indicates the spectral class (OBAFGKM), which corresponds to temperature.
Composition: each element absorbs a unique set of wavelengths, so matching the star's absorption lines with laboratory spectra identifies the elements in its atmosphere, and the relative strength of the lines indicates their abundance.
Translational velocity: if all the lines are shifted by the same fraction, the star is moving along our line of sight: redshift means away, blueshift means towards, and $v = c\Delta\lambda/\lambda$.
Rotation: one limb approaches and the other recedes, so light from them is blueshifted and redshifted; combined, each line is broadened. Wider lines mean faster rotation.
Density: in a dense atmosphere, frequent collisions broaden the lines (pressure broadening). Narrow lines indicate a low-density atmosphere, as in giants and supergiants, which gives the star's luminosity class.